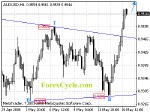
 AUDUSD Analysis.
AUDUSD breaks above the symmetrical triangle pattern and up trend resumes. Further rise to 0.9800 area to reach the next short term cycle top is expected. Initial support is at 0.9400 and followed by 0.9291.
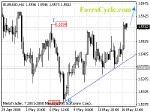 EURUSD Analysis.
EURUSD broke above 1.5594 previous high resistance and is now in up trend. Further rebound to 1.5700 is expected in a couple of days. Near term support is at the up trend line from 1.5284 to 1.5419, as long as the trend line support holds, up trend will continue.
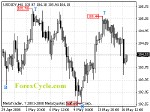 USDJPY Analysis.
USDJPY pulled back from 105.44 and formed a short term cycle top on 4-hour chart. Sideways consolidation in a range between 105.70 and 102.58 is possible in the next few days. As long as 102.58 support holds, we’d expect up trend to resume and rise to 10700 area is still in favor after consolidation.
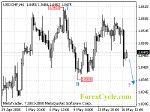 USDCHF Analysis.
USDCHF is formed a sideways consolidation in a range between 1.0388 and 1.0623. Break below 1.0388 level will more likely be seen. Key resistance is at 1.0623, only break of this level will signal resumption of the long term up trend.
 GBPUSD Analysis.
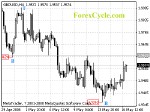
GBPUSD rebounded from 1.9363 and the rise would possibly be sideways consolidation in a range between 1.9363 and 1.9633. Down trend will resume after consolidation and a break of 1.9363 will indicate that the pair is back to down trend.
 USDCAD Analysis.
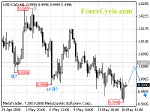
No changed in our view, USDCAD is in down trend. The fall from 1.0242 extends to as low as 0.9942 level. Further fall to 0.9800 area is still possible after consolidation. Near term resistance is at 1.0067, as long as this resistance holds, down trend will continue.
