Subscribe our Short Term Analysis at $19.95/mo
You can subscribe our Short Term Analysis at $19.95 per month before the end of September 2006.
USDJPY
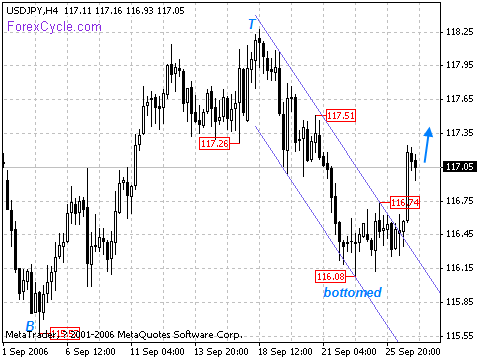 USDJPY’s down trend is limited by the price channel on daily chart, it has bottomed at 116.08 on 4 hours chart, and further rise towards 117.51 near term resistance to reach the next cycle top is possible later today. Key support is now at 116.08, only break below this level may signal the resumption of the down trend.
USDCAD
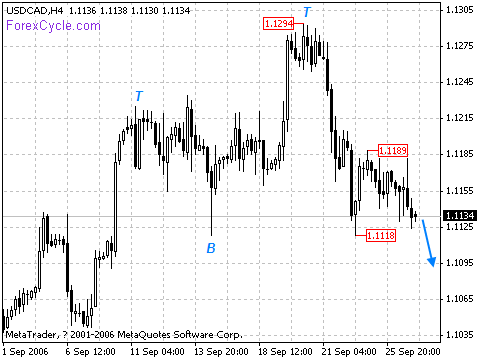 USDCAD is in down trend, further fall below 1.1118 to reach the next cycle bottom is possible in the next couple of days. Key resistance is now at 1.1189, only break above this level may label the cycle bottom at 1.1118.
EURUSD
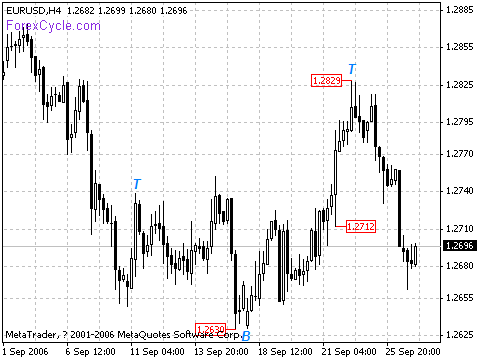 EURUSD broke below the key support at 1.2712 and topped at 1.2829 high. Further fall towards 1.2630 previous low support to reach the next cycle bottom is still possible later today. The near term support at 1.2630 is more likely to be held by the end of the cycle.
USDCHF
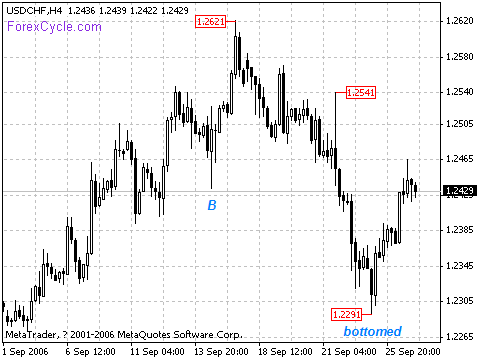 USDCHF’s down trend is limited by the price channel on daily chart, it has bottomed on 4 hours chart. Further rise towards 1.2541 to reach the next cycle top is still possible later today. Key support is now at 1.2291, a break below this level may signal the resumption of the down trend.
AUDUSD
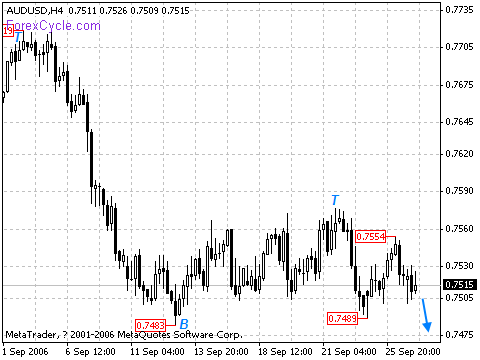 AUDUSD is in down trend, the rebound from 0.7489 is treated as in correction to the down trend, and further fall below 0.7483 is still possible in the next couple of days. Key resistance is now at 0.7554, only break above this level may signal the reversal to the down trend.
GBPUSD
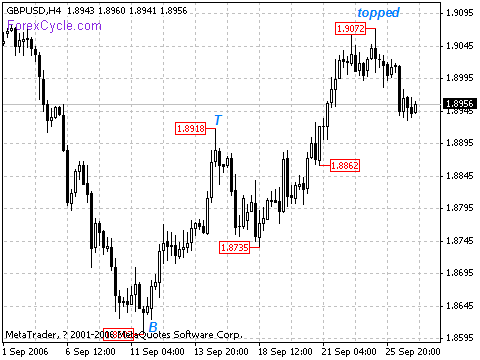 GBPUSD has topped on 4 hours chart, it would form a sideways consolidation in a range between 1.8900 and 1.9100 in the next several days. Up trend will resume after this consolidation.