By Gary Grimes
The following article is adapted from market analysis by Elliott Wave International Chief Commodity Analyst Jeffrey Kennedy. Now through July 22, Jeffrey Kennedy’s daily, intermediate, and long-term forecasts for up to 18 markets are free via EWI’s FreeWeek. Learn more here.
Wave patterns are like beautiful women, classic cars and great art – you know them when you see them.
EWI analyst Jeffrey Kennedy drives this point home during his live Elliott wave trading tutorial. It’s my favorite of his tips for trading with Elliott waves.
"Trade the pattern not the count," Jeffrey says.
If you don’t recognize a pattern at a glance, don’t trade it – plain and simple. After all, your wave count can be wrong; the pattern cannot.
Does that mean you must know the exact wave count at a glance, as well? No. Simply spotting a pattern you recognize is where you should start.
Jeffrey scans hundreds of charts, clicking through them one by one, spending mere seconds with each. If he doesn’t spot a pattern he recognizes, a click of his mouse takes him to another potential opportunity.
Does price action look extended or choppy? Is it trading in a channel? Is it forming a wedge or triangle shape? These are some of the signals Jeffrey’s looking for. Each could help him identify – at the quickest of glances – whether price action is impulsive or corrective. This is the first critical step, Jeffrey says, to spotting high-confidence, Elliott wave trade setups.
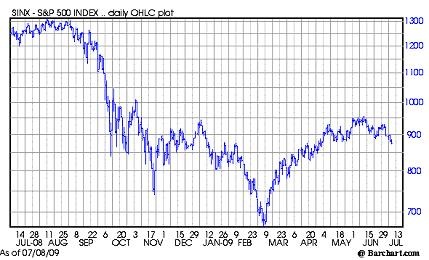
That brings us to the following chart. Do you see a pattern you recognize? I do.

Look at the downward price action; the moves look decisive, almost in straight lines like impulse waves. Now look at the upward moves; they look indecisive and choppy like corrections. There’s also one down move that is clearly longer than the others – that’s almost certainly a third wave of some degree.
At just a glance, here are a few things we can determine:
* This is a bearish market pattern, because downward impulses are interrupted by upward corrections.
* The price action from September to November seems to be a pretty clear wave 3 down, followed by waves 4 up then 5 down, completing what appears to be a larger degree wave 1 in early March.
* Wave 2 follows wave 1, so the upward move starting in early March is most likely a larger degree wave 2.
* Wave 3 follows wave 2, so that’s what we can expect next.
* Wave 3 is never the shortest and often the longest of all five waves, so we can expect the next impulse move to take prices to new lows.
You see, with just a quick glance, we’ve put a finger on the pulse of the market. Negative psychology pulls prices down, and brief reversals of mood result in upward corrections – this appears to be a long-term bear market.
If you can gain this much insight simply by glancing at a chart, just think of what else you can glean by spending more time with it. Look at this pattern within a longer time frame, and you can determine the degree of trend (this one appears to be primary). Formulate Fibonacci price and time targets, and you can be confident about when and where prices will most likely turn.
There are literally hundreds of things you can do with a good chart, but none of them mean much unless you can first identify a pattern you recognize.
———
For more information on using patterns to spot trading opportunities, access Elliott Wave International’s FreeWeek. Now through July 22, all of EWI Chief Commodity Analyst Jeffrey Kennedy’s daily, intermediate, and long-term market forecasts are completely free. Learn more here.
