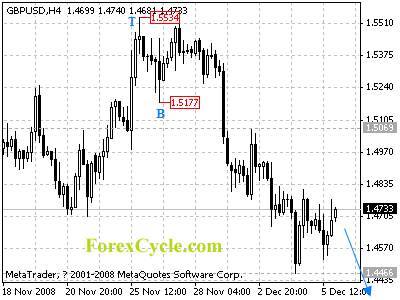
GBPUSD Analysis.
GBPUSD is in down trend. The rebound from 1.4466 is treated as consolidation to down trend. Initial resistance is at 1.4900 and followed by 1.5069. As long as 1.5069 resistance holds, we’d expect down trend to resume and deeper decline could be seen to 1.4000 zone. However, above 1.5069 will indicate lengthier consolidation of long term down trend is underway, and further rally to retest 1.5534 resistance could be seen to follow.
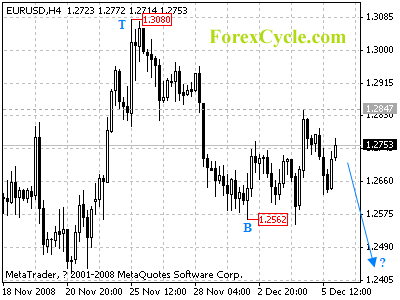
EURUSD Analysis.
EURUSD trades in a range between 1.2549 and 1.2847. The price action from 1.2562 is treated as consolidation of down trend. As long as 1.2847 resistance holds, we’d expect down trend to resume, and deeper decline is expected to retest 1.2329 (Oct 28 low) support after correction. If this level gives way, the next target would be at 1.2000 zone. Only rise above 1.2847 level will signal further rally to 1.2950 zone.
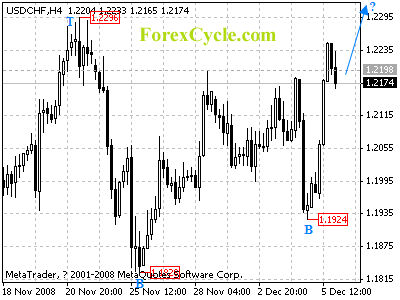
USDCHF Analysis.
USDCHF breaks above 1.2198 resistance, suggesting that a short term cycle bottom has been formed at 1.1924 level on 4-hour chart. Further rise is still possible in a couple of days, short term target would be at 1.2500 zone, and a break above 1.2296 previous high resistance will confirm such case.
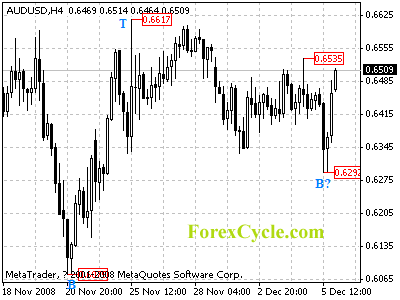
AUDUSD Analysis.
AUDUSD rebounds sharply from 0.6292 last Saturday, and is testing 0.6535 resistance. A break above this level will indicate that the fall from 0.6617 has completed, and further rally towards 0.6800 zone is expected to follow.
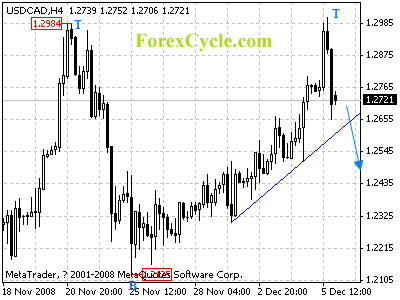
USDCAD Analysis.
As expected, USDCAD fails to test 1.3015 (Oct 28 high) resistance, and pulls back sharply from 1.3005 level, suggesting that a short term cycle top has been formed. Further fall is expected to1.2300 zone, and a break below this up trend line on 4-hour chart will confirm such case. Key resistance is at 1.3015, above this level will indicate that the sideways consolidation from 1.3015 has completed and then rise towards 1.3500 could be seen.
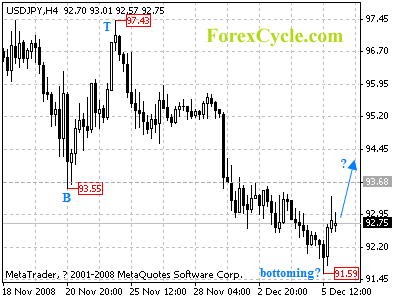
USDJPY Analysis.
Being contained by the long term key support at 90.92 (Oct 24 low), USDJPY rebounds from 91.59 level, suggesting that the pair is forming a short term cycle bottom on 4-hour chart. Key resistance is located at 93.68, a break above this level will confirm the cycle bottom, and then further rally could be seen to 96.00 zone.
Get Your Free Elliott Wave Tutorial Now!
See also:
Forex Articles
Forex Reviews
Powerful Profit System
Automate Your Trading Profits
Boost your Profit to Extreme