USDJPY Analysis.
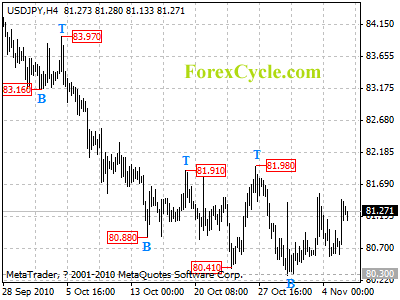
USDJPY moved sideways in a range between 80.30 and 81.98 for several weeks. Lengthier consolidation in the rang is still possible in a couple of days. As long as 81.98 resistance holds, we’d expect downtrend to resume and another fall towards 79.75 (1995 low) is still possible, and a break below 80.55 could signal resumption of downtrend. Key resistance is at 81.98, above this level will indicate that the downtrend from 85.92 (Sep 17 high) has completed at 80.30 already, then the following upward move could bring price back to 83.00-84.00 area.
USDCAD Analysis.
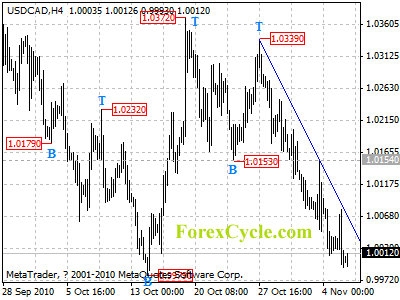
USDCAD is facing 0.9979 previous low support, a breakdown below this level could trigger another fall towards 0.9500 area. Resistance remains at the downtrend line from 1.0339 to 1.0154, only a clear break above the trend line resistance could indicate that the fall from 1.0339 is complete.
GBPUSD Analysis.
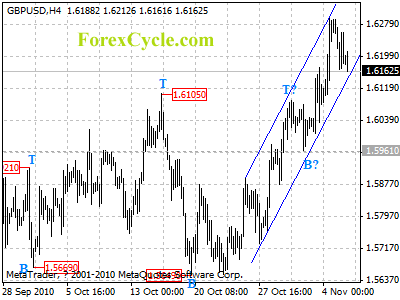
GBPUSD stays in a rising price channel on 4-hour chart and remains in uptrend from 1.5649. Support is at the lower border of the channel, now at 1.6145. As long as the channel support holds, uptrend is expected to continue and next target would be at 1.6500. However, a clear break below this channel support could indicate that lengthier consolidation of uptrend is underway, then pullback to 1.6000 could be seen.
EURUSD Analysis.
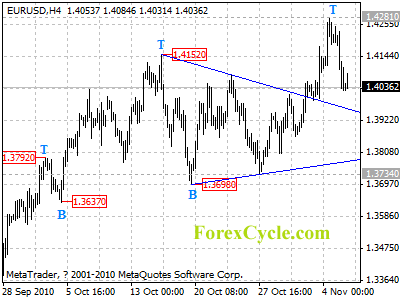
EURUSD dropped sharply from 1.4281 last Friday, suggesting that the rise from 1.3734 has completed. Another fall to 1.3800-1.3900 area is expected in a couple of days. Key resistance is at 1.4281, only break above this level could trigger another rise towards 1.4500 zone.
USDCHF Analysis.
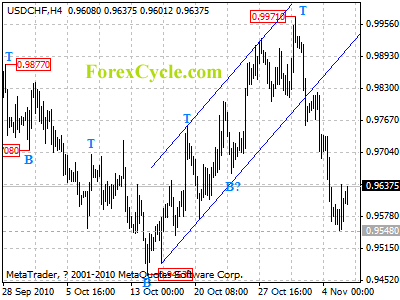
USDCHF’s fall extended to as low as 0.9548 last week. Further decline is still possible later today and target is at 0.9463 previous low. Resistance is at 0.9685, only break above this level could indicate that the fall from 0.9971 is complete.
AUDUSD Analysis.
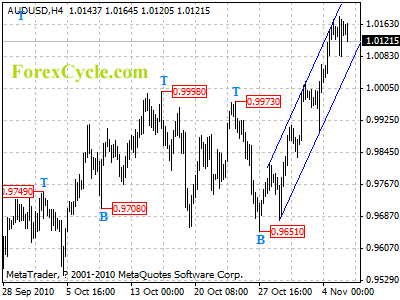
AUDUSD stays in a rising price channel on 4-hour chart and remains in uptrend from 0.9651. As long as the channel support holds, uptrend is expected to continue and next target would be at 1.0400 area. However, a clear break below the channel support could indicate that the rise from 0.9651 has completed, then pullback to 1.0000 area could be seen.
Get Your Free Elliott Wave Tutorial Now!
See also:
Forex Articles
Powerful Profit System
Automate Your Trading Profits
Boost your Profit to Extreme
