USDJPY
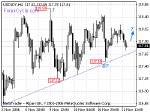 USDJPY moved without trend in a narrow range between 117.12 and 118.58 for two weeks. Further rise above 118.58 to reach the next cycle top on 4 hours chart will more likely be seen in the next several days. On the other side, fall below 117.12 is still possible if the up trend line (from 116.57 to 117.12, now at 117.65) support is broken below.
AUDUSD
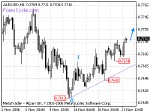 AUDUSD bottomed at 0.7613 on 4 hours chart and further rise towards 0.7750 level can be expected in the next several days. Near term support is at 0.7674, only break below this level would pull price back to test 0.7642 previous low support.
USDCAD
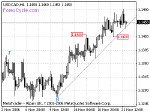 USDCAD is testing the up trend line support, and break below the trend line support implies that the pair is topping on 4 hours chart. Key support is now at 1.1420, a break below this level may confirm the cycle top.
USDCHF
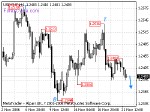 USDCHF topped at 1.2536 on 4 hours chart, further fall towards 1.2360 level to reach the next cycle bottom on 4 hours chart can be expected in the next several days. Near term resistance is at 1.2450, only break above this level would pull price back to 1.2475 area.
GBPUSD
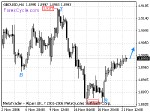 GBPUSD bottomed at 1.8834 on 4 hours chart and further rise towards 1.9100 level is still possible in the next several days. Near term support is at 1.8930, and as long as this support holds, up trend will continue.
EURUSD
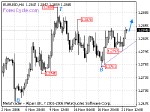 EURUSD bottomed at 1.2761 on 4 hours chart, and further rise above 1.2870 to reach the next cycle top can be expected in the next several days. Near term support is at the up trend line (from 1.2761 to 1.2797), and the key support is now at 1.2797, a break below the key support may signal the next cycle top.
