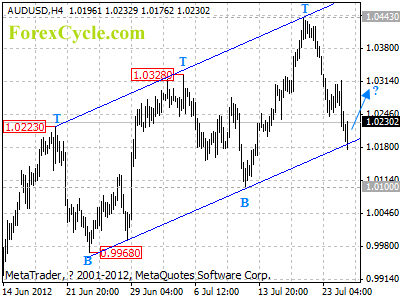
AUDUSD Analysis.
AUDUSD has reached the lower line of the price channel on 4-hour chart, rebound could be expected later today. Resistance is now at 1.0280, a break above this level will indicate that a cycle bottom has been formed, then another rise towards 1.0500 could be seen. On the downside, a clear break below the lower line of the channel will suggest that the longer term uptrend from 0.9581 (Jun 1 low) has completed at 1.0443 already, then the following downward move could bring price back to 0.9900 zone.
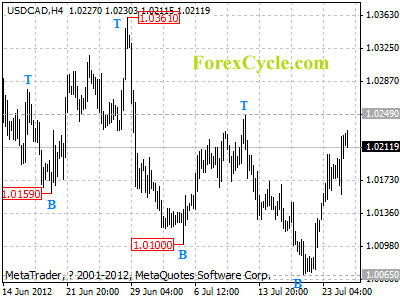
USDCAD Analysis.
USDCAD is facing 1.0249 resistance, a break above this level will indicate that the downtrend from 1.0445 (Jun 4 high) has completed at 1.0065 already, then the following upward movement could bring price back to 1.0350-1.0400 area. On the downside, as long as 1.0249 key resistance holds, we’d expect downtrend to resume, and another fall towards 1.0000 is still possible.
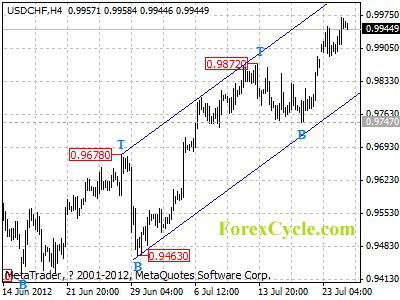
USDCHF Analysis.
USDCHF remains in uptrend from 0.9421 (Jun 18 low), and the rise extends to as high as 0.9971. Further rise could be expected in a couple of days, and next target would be at 1.0050 area. Initial support is at 0.9885, and the key support is at the lower line of the price channel on 4-hour chart, only a clear break below the channel support could signal completion of the uptrend.
USDJPY Analysis.
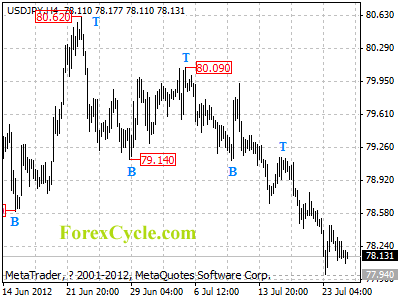
Being contained by 77.66 (Jun 1 low) support, USDJPY rebounds from 77.94. However, the bounce is likely consolidation of the downtrend from 80.09, another fall to test 77.66 support is still possible. Resistance is at 78.60, only break above this level could signal completion of the downtrend.
GBPUSD Analysis.
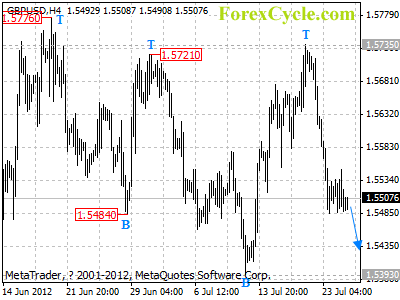
GBPUSD remains in downtrend from 1.5735. Another fall to test 1.5393 support could be seen after a minor consolidation. Resistance is at 1.5580, only break above this level could indicate that a cycle bottom is being formed on 4-hour chart.
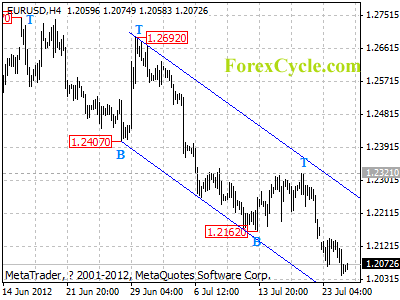
EURUSD Analysis.
EURUSD remains in downtrend from 1.2747 (Jun 18 high). Further decline would likely be seen after a minor consolidation, and next target would be at 1.1900 area. Key resistance is at the upper line of the price channel on 4-hour chart, only a clear break above the channel resistance could signal completion of the downtrend.
