USDJPY Analysis.
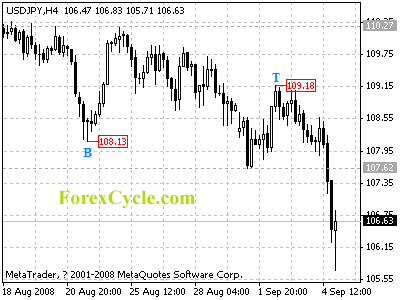
As expected, USDJPY breaks below 107.62 previous low support and reaches as low as 105.71 level. Deeper decline is still possible to 105.00 zone. Near term resistance is located at 107.62, a break of this level will indicate that a short term cycle bottom has been formed and the fall from 110.66 (Aug 15 high) has completed, subsequent rebounds will bring price back to test 110.66 previous high resistance.
USDCHF Analysis.
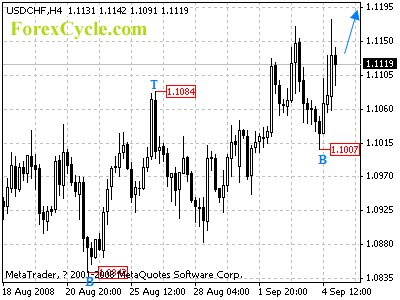
USDCHF formed a short term cycle bottom at 1.1007 on 4H chart. Further rise to 1.1250 is possible in next few days. Initial support is now located at 1.1007, only break down below this level will indicate that the rise from 1.0010 has completed, and then deeper decline is expected to 1.0650 level.
USDCAD Analysis.
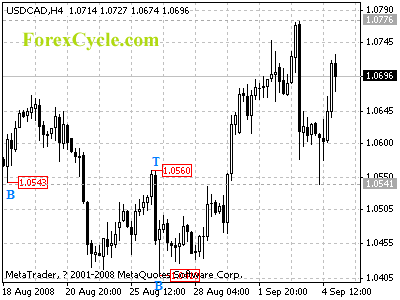
USDCAD traded in range between 1.0541 and 1.0776. As long as 1.0776 resistance holds, we’d expect down trend to resume and deeper decline towards 1.0500 is still possible. However, a break of 1.0776 resistance will signal further rally to 1.0850 zone.
AUDUSD Analysis.
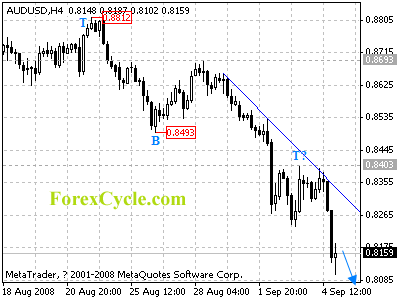
Being contained by the resistance of the down trend line, AUDUSD pulled back from 0.8393 level. Deeper decline is expected to 0.7900 next week. Initial resistance is now at 0.8403, only break of this level will take price back to 0.8500 zone.
EURUSD Analysis.
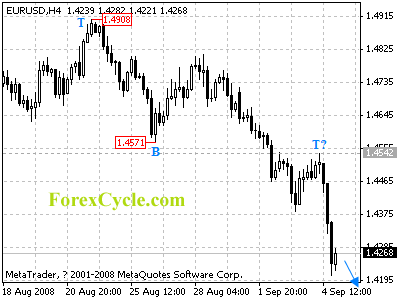
EURUSD is remains in bearish movement and the fall from 1.6038 (July 15 high) extends to 1.4209 level. Further fall towards 1.4000 zone is now in favor. Initial resistance is at 1.4542, only break of this level will signal consolidation to down trend.
GBPUSD Analysis.
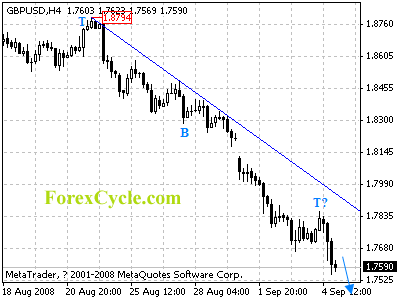
GBPUSD remains in down trend. The fall form 1.8794 extends further to 1.7555 level. Deeper decline is still possible to 1.7400 level. Initial resistance is at the down trend line, and as long as the pair stays below the trend line resistance, we’d expect down trend to continue.
Get Your Free Elliott Wave Tutorial Now!
See also:
Forex Articles
Forex Reviews
Powerful Profit System
Automate Your Trading Profits
Boost your Profit to Extreme

Comments are closed.