AUDUSD Analysis.
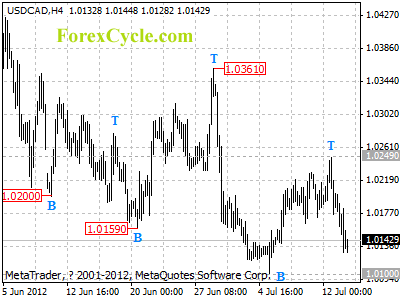
Being supported by the lower line of the price channel on 4-hour chart, AUDUSD rebounds from 1.0100, suggesting that a cycle bottom has been formed. Now the bounce would possibly be resumption of the longer term uptrend from 0.9581 (Jun 1 low), further rise to test 1.0328 previous high resistance could be expected, a break above this level will target 1.0500 zone. Key support is now at 1.0100, only break below this level will indicate that the uptrend from 0.9581 is complete.
USDJPY Analysis.
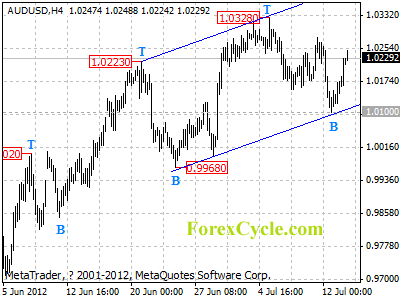
USDJPY is now in downtrend from 80.62. Further decline would likely be seen, and next target would be at 78.50 area. Resistance is located at the downward trend line on 4-hour chart, only a clear break above the trend line could trigger another rise towards 83.00.
EURUSD Analysis.
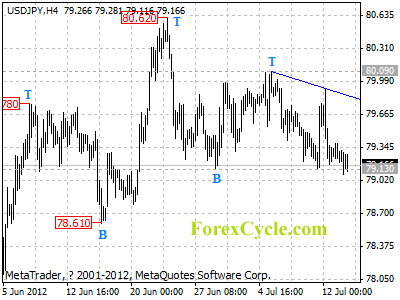
EURUSD may be forming a cycle bottom at 1.2162 on 4-hour chart. Range trading between 1.2162 and 1.2400 would likely be seen over the next several days. Key resistance is at the upper line of the price channel, as long as the channel resistance holds, the rise from 1.2162 is treated as consolidation of the downtrend from 1.2747, and another fall towards 1.2000 is possible after consolidation. Support is at 1.2162, a breakdown below this level could signal resumption of the downtrend.
USDCHF Analysis.
USDCHF may be forming a cycle top at 0.9872 on 4-hour chart. Consolidation of the uptrend from 0.9421 would likely be seen over the next several days, and the trading range would be between 0.9700 and 0.9872. Key support is located at the lower border of the price channel, as long as the channel support holds, we’d expect uptrend to resume, and one more rise towards 1.0000 is possible after consolidation. Resistance is at 0.9872 a break above this level could signal resumption of the uptrend.

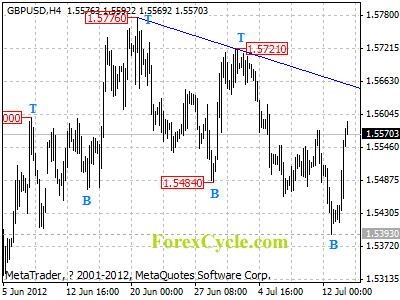
GBPUSD Analysis.
GBPUSD has formed a cycle bottom at 1.5393 on 4-hour chart. Further rise to test the resistance of the downward trend line from 1.5776 to 1.5721 is expected. As long as the trend line resistance holds, the rise from 1.5393 is treated as consolidation of the downtrend from 1.5776, and another fall towards 1.5000 is still possible after consolidation.
USDCAD Analysis.
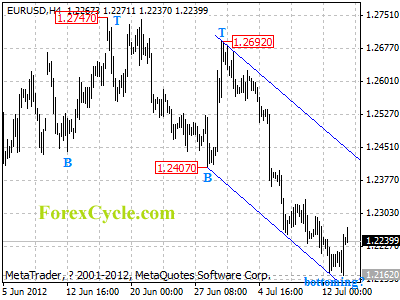
USDCAD has formed a cycle top at 1.0249 on 4-hour chart. Further decline to test 1.0100 support is expected, a breakdown below this level will confirm the the downtrend from 1.0445 has resumed, then next target would be at 1.0000. On the upside, as long as 1.0100 support holds, one more rise to 1.0300 to complete to consolidation of the downtrend from 1.0445 is still possible.
