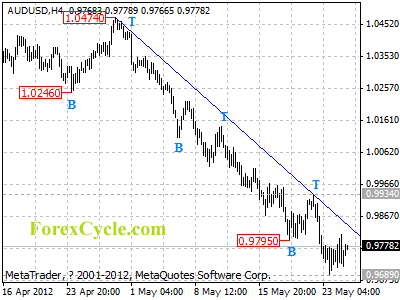
AUDUSD Analysis.
AUDUSD stays below a downward trend line on 4-hour chart, and remains in downtrend from 1.0474, the rise from 0.9689 is treated as consolidation of the downtrend. As long as the trend line resistance holds, we’d expect downtrend to resume, and next target would be at 0.9600 area. However, a clear break above the trend line resistance will indicate that the downward movement from 1.0474 has completed at 0.9689 already, then the following upward movement could bring price back to 1.0600 zone.
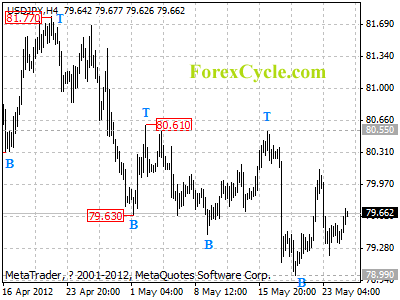
USDJPY Analysis.
USDJPY continues its sideways movement in a range between 78.99 and 80.61. Key resistance is at 80.61, as long as this level holds, the price action in the range is treated as consolidation of the downtrend from 84.17 (Mar 15 high), and one more fall towards 78.00 is still possible after consolidation. However, a break above 80.61 will indicate that the downward movement from 84.17 has completed at 78.99 already, and the target for the following upward movement would be at 83.00 area.
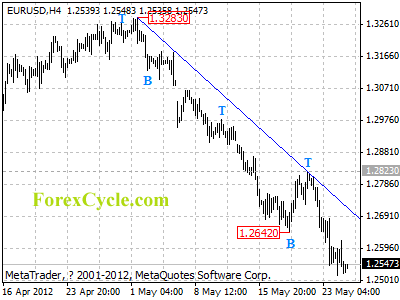
EURUSD Analysis.
EURUSD’s downwards movement from 1.3283 extends to as low as 1.2516. Resistance is at downtrend line from 1.3283 to 1.2823, as long as the trend line resistance holds, downtrend could be expected to continue, and next target would be at 1.2400 area.
GBPUSD Analysis.
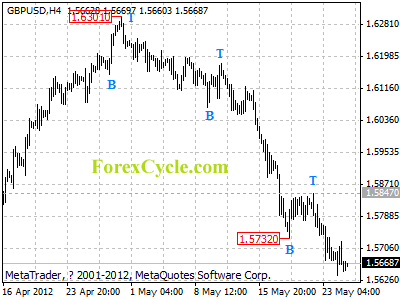
GBPUSD’s downward movement from 1.6301 extends to as low as 1.5638. Further decline would likely be seen after a minor consolidation, and next target would be at 1.5600 area. Key resistance is at 1.5847, only break above this level could signal completion of the downtrend.
USDCAD Analysis.
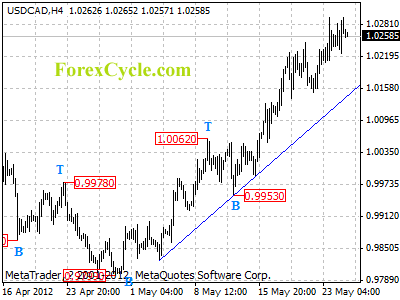
USDCAD continues its upward movement from 0.9799 and the rise extends to as high as 1.0295. Further rise could be expected after consolidation, and next target would be at 1.0400 area. Key support is located at the uptrend line on 4-hour chart, only a clear break below the trend line could signal completion of the uptrend.
USDCHF Analysis.
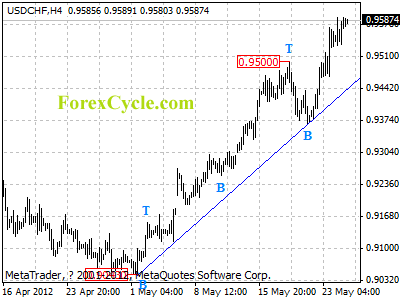
USDCHF is testing 0.9594 (Jan 9 high) resistance, a break above this level will signal resumption of the uptrend from 0.7067 (Aug 9, 2011 low). Support is at the upward trend line on 4-hour chart, only a clear break below the trend line support could signal completion of the upward movement from 0.9043.
