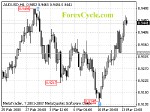
 AUDUSD Analysis.
AUDUSD formed a short term cycle bottom at 0.9147 level on 4-hour chart. Further rise to test the previous high resistance at 0.9496 is still possible later today, a break above this resistance indicates that the long term up trend is resumed, and then, further rise to 0.9600 is expected to follow. Near term support is at 0.9329, a break of this level will pull price back to retest 0.9147 previous low.
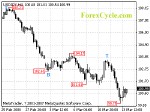 USDJPY Analysis.
USDJPY broke below 101.41 previous low support and reached as low as 99.75. Further fall to 98.00 area to reach the next short term cycle bottom on 4-hour chart is still possible. Near term resistance is at 101.75, as long as this resistance holds, down trend will continue.
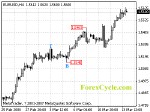 EURUSD Analysis.
EURUSD is in up trend and the rise from 1.4438 (Feb 7 low) extends to as high as 1.5644. Further rally to 1.5800 area to reach the next short term cycle top on 4-hour chart is expected. Near term support is now at 1.5500, as long as this support holds, up trend to will continue.
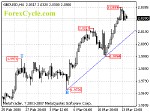 GBPUSD Analysis.
GBPUSD’s up trend remains, and the rise from 1.9361extends to as high as 2.0389. Further rally to 2.0600 area to reach the next short term cycle top on 4-hour chart is still possible in a couple of day. Near term support is at 2.0175 and followed by the up trend line from 1.9720 to 1.9994, now at 2.0140, as long as the trend line support holds, we’d expect up trend to continue.
 USDCHF Analysis.
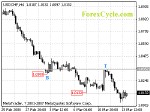
USDCHF broke below 1.0132 previous low and reached as low as 1.0042. Further fall to 0.9900 area is still possible in a couple of days. Near term resistance is at 1.0215, as long as this resistance holds, down trend will continue.
 USDCAD Analysis.
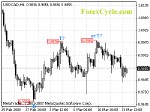
USDCAD formed a sideways consolidation in a range between 0.9709 and 0.9981. Further rise to 1.0050 area to reach the next short term cycle top on 4-hour chart is still possible in the next several days. Key support is at 0.9709, a breakdown of this level indicates that the long term down trend is resumed and further fall to test 0.9056 (Nov 7, 2007 low) is expected to follow.
More long term forex analysis.
See also:
Forex Articles
Forex Reviews
Powerful Profit System
Automate Your Trading Profits
Boost your Profit to Extreme
