USDJPY Analysis.
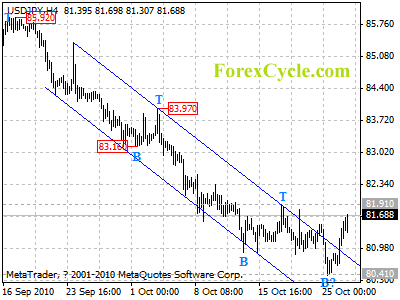
USDJPY broke above the falling price channel on 4-hour chart and reaches as high as 81.70. Key resistance is at 81.91, as long as this level holds, the price action in the trading range between 80.41 and 81.91 is treated as consolidation of downtrend from 85.92, and one more fall to 80.00 is still possible. However, a break above 81.91 key resistance will indicate that the downtrend from 95.92 has completed at 80.41 already, then the following upward move could bring price to 83.00-84.00 area.
EURUSD Analysis.
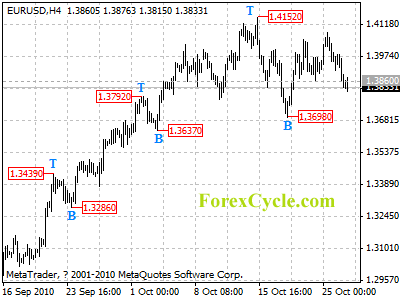
EURUSD breaks below 1.3860 support, suggesting lengthier consolidation in the trading range between 1.3698 and 1.4152 is underway. Deeper decline towards 1.3698 is expected later today, rebound would more likely be seen before breaking below this level. However a breakdown below 1.3698 level will indicate that the uptrend from 1.2587 (Aug 24 low) has completed at 1.4152 already, then the following downward move could bring price to 1.3400 area.
AUDUSD Analysis.
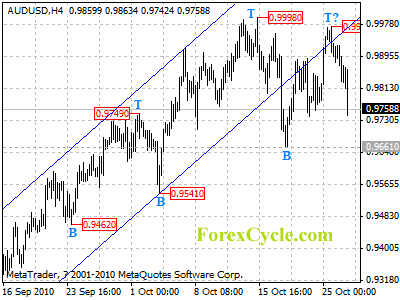
AUDUSD failed to break above 0.9998 previous high resistance and pulled back from 0.9973, suggesting another fall towards 0.9661 key support is underway, a break below this level will indicate that the rise from 0.8771 has completed at 0.9998 already, then the following downward move could bring price back to 0.9300 area.
USDCHF Analysis.
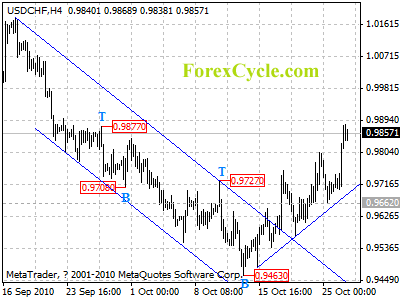
USDCHF’s bounce from 0.9463 extends to as high as 0.9881 level. Further rally is still possible later today and next target would be at 1.0000 area. Initial support is at the rising trend line on 4-hour chart and the key support is at 0.9662, only break below this level could trigger another fall to 0.9200 zone.
USDCAD Analysis.
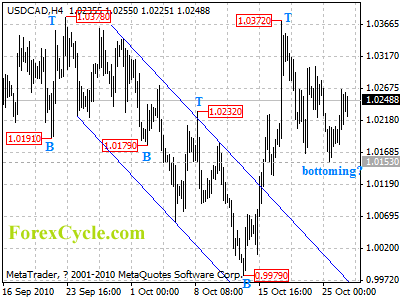
USDCAD might be forming a cycle bottom at 1.0153 level on 4-hour chart. Further rise towards 1.0372 is expected later today, a break above this level could confirm that a cycle bottom has been formed and another rise towards 1.0600 is underway.
GBPUSD Analysis.
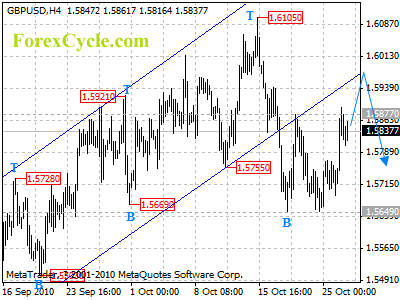
GBPUSD broke above 1.5877 resistance, further rise to 1.5950-1.6000 area to reach next cycle top on 4-hour chart could be seen. As long as 1.6105 resistance holds, we’d expected downtrend to resume and one more fall towards 1.5400 is still possible.
Get Your Free Elliott Wave Tutorial Now!
See also:
Forex Articles
Powerful Profit System
Automate Your Trading Profits
Boost your Profit to Extreme
