GBPUSD Analysis.
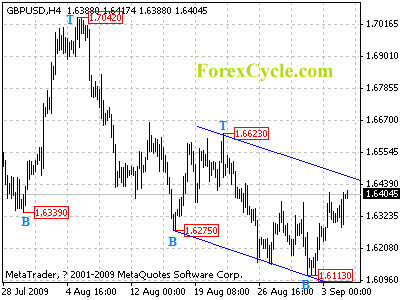
GBPUSD formed a short term cycle bottom at 1.6113 level on 4-hour chart. Further rise to test the resistance of the upper border of the falling price channel is expected later today. Key resistance remains at 1.6623, as long as this level holds, we’d expect downtrend to resume, and another fall towards 1.5900 is possible before breaking above 1.6623 level. However, above 1.6623 will suggest that the downtrend from 1.7042 has completed at 1.6113 level.
USDCAD Analysis.
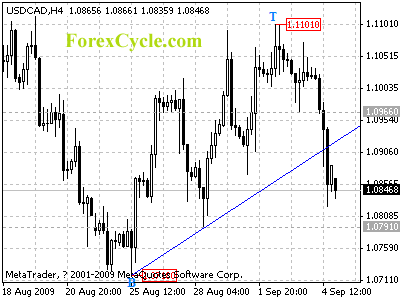
USDCAD broke below the rising trend line from 1.0718 to 1.0791 and reached as low as 1.0823, suggesting that a short term cycle top has been formed at 1.1101 level on 4-hour chart. Deeper decline is possible to test 1.0718 support in a couple of days. Near term resistance is at 1.0885 followed by 1.0925, as long as these levels hold, downtrend from 1.1101 will continue.
AUDUSD Analysis.
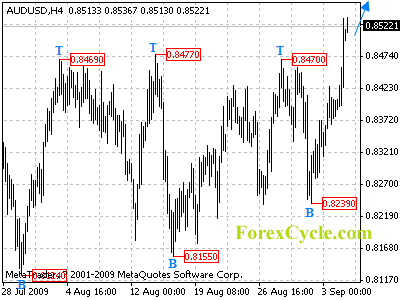
AUDUSD broke above 0.8477 key resistance. Now the uptrend from 0.7703 has resumed. Further rise to 0.8700 zone is expected in a couple of days. Near term support is at 0.8495 followed by 0.8460, as long as these levels hold, uptrend from 0.8239 will continue.
EURUSD Analysis.
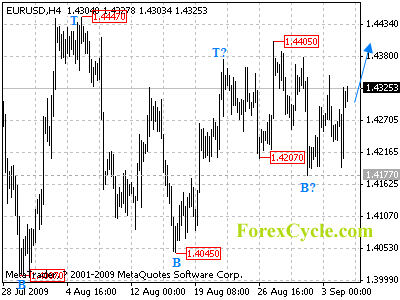
EURUSD stays in a trading range between 1.4177 and 1.4405. Further rise to test 1.4405 would more likely be seen later today, a break above this level will indicate that the uptrend from 1.3748 (June 16 low) has resumed, then next short term target would be at 1.4550-1.4600 area. Near term support is at 1.4177, only fall below this level will take price to 1.4050-1.4100 area.
USDCHF Analysis.
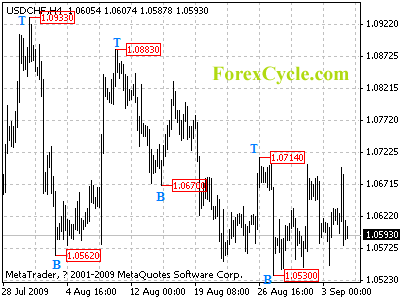
USDCHF continues its range trading between 1.0530 and 1.0714. As long as 1.0714 resistance holds, we’d expect downtrend to continue and deeper decline to 1.0450-1.0500 area is possible. However, above 1.7014 will indicate that the downtrend from 1.0883 has completed at 1.0530 level already, then the following uptrend will take price towards 1.1000 zone.
USDJPY Analysis.
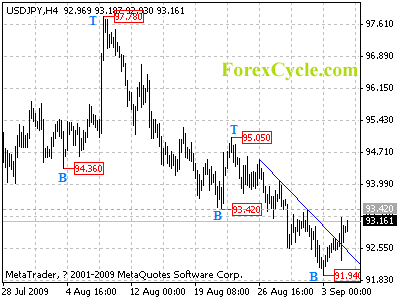
USDJPY broke above the falling trend line on 4-hour chart, suggesting that a short term cycle bottom has been formed at 91.94 level. Range trading between 91.94 and 93.42 is expected in a couple of days. However, the rise from 91.94 is more likely consolidation of downtrend from 97.78, another fall towards 89.00-90.00 area is still possible after consolidation.
Get Your Free Elliott Wave Tutorial Now!
See also:
Forex Articles
Forex Reviews
Powerful Profit System
Automate Your Trading Profits
Boost your Profit to Extreme
