Subscribe our Short Term Analysis at $19.95/mo
You can subscribe our Short Term Analysis at $19.95 per month before the end of September 2006.
USDJPY
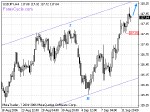 As expected, USDJPY broke above 117.87 previous high resistance. Further rise towards the top of the price channel is possible later today. Key support is now at 117.39, only break below the level may delay the up trend.
EURUSD
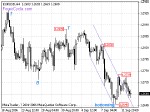 EURUSD broke above the price channel and may be bottoming on 4 hours chart, key resistance is at 1.2739, a break above this level may label the cycle bottom at 1.2648. On the other side, EURUSD may be forming a sideways consolidation to the down trend, in a rage between 1.2648 and 1.2739, key support is at 1.2648, a break below this level may signal the resumption of the down trend.
AUDUSD
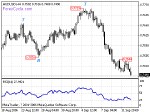 AUDUSD is in down trend, and the key resistance is at 0.7544, as long as the key resistance holds, down tend will continue. On the other side, the cycle bottom is nearing and the RSI is low, rebound towards 0.7550 level is needed before the resumption of the down trend.
USDCHF
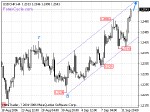 USDCHF is running in a rising price channel, further move higher towards the top of the price channel to reach the next cycle top is possible later today. Key support is at 1.2393, a break below this level may signal the cycle top.
GBPUSD
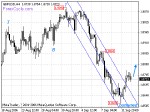 GBPUSD broke above the standard deviation channel, and it has bottomed at 1.8602 on 4 hours chart. Further rise towards 1.8868 is possible in the next couple of days. Key support is at 1.8602, only break below this level may signal the resumption of the down trend.
USDCAD
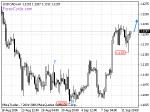 USDCAD is forming a consolidation to the up trend, and further rise above 1.1271 previous high resistance is possible later today. Key support is now at 1.1155, only break below this level may delay the resumption of the up trend.
