EURUSD
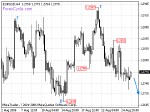 EURUSD is moving down to reach the next cycle bottom. Key resistance is at 1.2851, break above this level may signal the cycle bottom. Near term support is at 1.2695, it is more likely to be held by the end of this cycle. Slightly break below this support and rebound is another way to reach the next cycle bottom.
USDJPY
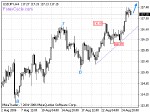 As expected, USDJPY broke above 116.83 level. It is in up trend and further rise towards 118.00 is possible in the next couple of days. Near term support is the up trend line, now at 116.50 level, and as long as this up trend line support holds, up trend will continue.
USDCHF
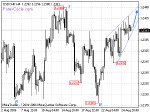 USDCHF is in a ascending triangle pattern. This pattern implies the exhaustion of the up trend. Down trend may resume after breaking down this pattern. On the other side, the pair is still in up trend, and further rise above 1.2444 to reach the next cycle top is possible in the next couple of days.
USDCAD
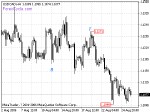 USDCAD is in down trend, and I believe that the end of this down trend fell from 1.1457 is nearing. I don’t suggest to take short positions at this moment.
AUDUSD
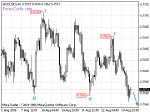 AUDUSD is in down trend, further fall towards 0.7500 level is possible in the next couple of days. Key resistance is at 0.7668, only rise above this level may signal the resumption of the up trend.
GBPUSD
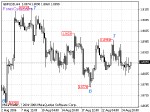 GBPUSD is forming a sideways consolidation in a range between 1.8774 and 1.9023 for about 15 business days. Break out this range is needed now. Key resistance is at 1.8994, break above this level may signal the resumption of the up trend and break below the near term support at 1.8774 would delay the resumption of the up trend.
